Manage & Automate Care
Automate assignments, monitoring, and iteration
Client DebriefsSummarize progress, flags, and follow-ups
AnalyticsOutcomes & insights in real time
Client Portal AppTasks, check-ins, streaks, and secure messaging
Homework LibraryEvidence-based activities spanning disciplines
Plan DesignerStructured care plans that adapt to progress
Rewards ProgramGift boxes and other incentives that sustain follow-through
Client SupportSelf-serve help, guided flows, and smart assistants
Activities Beyond Sessions
Personalized, on-demand support between visits
JournalingGuided prompts with reframing
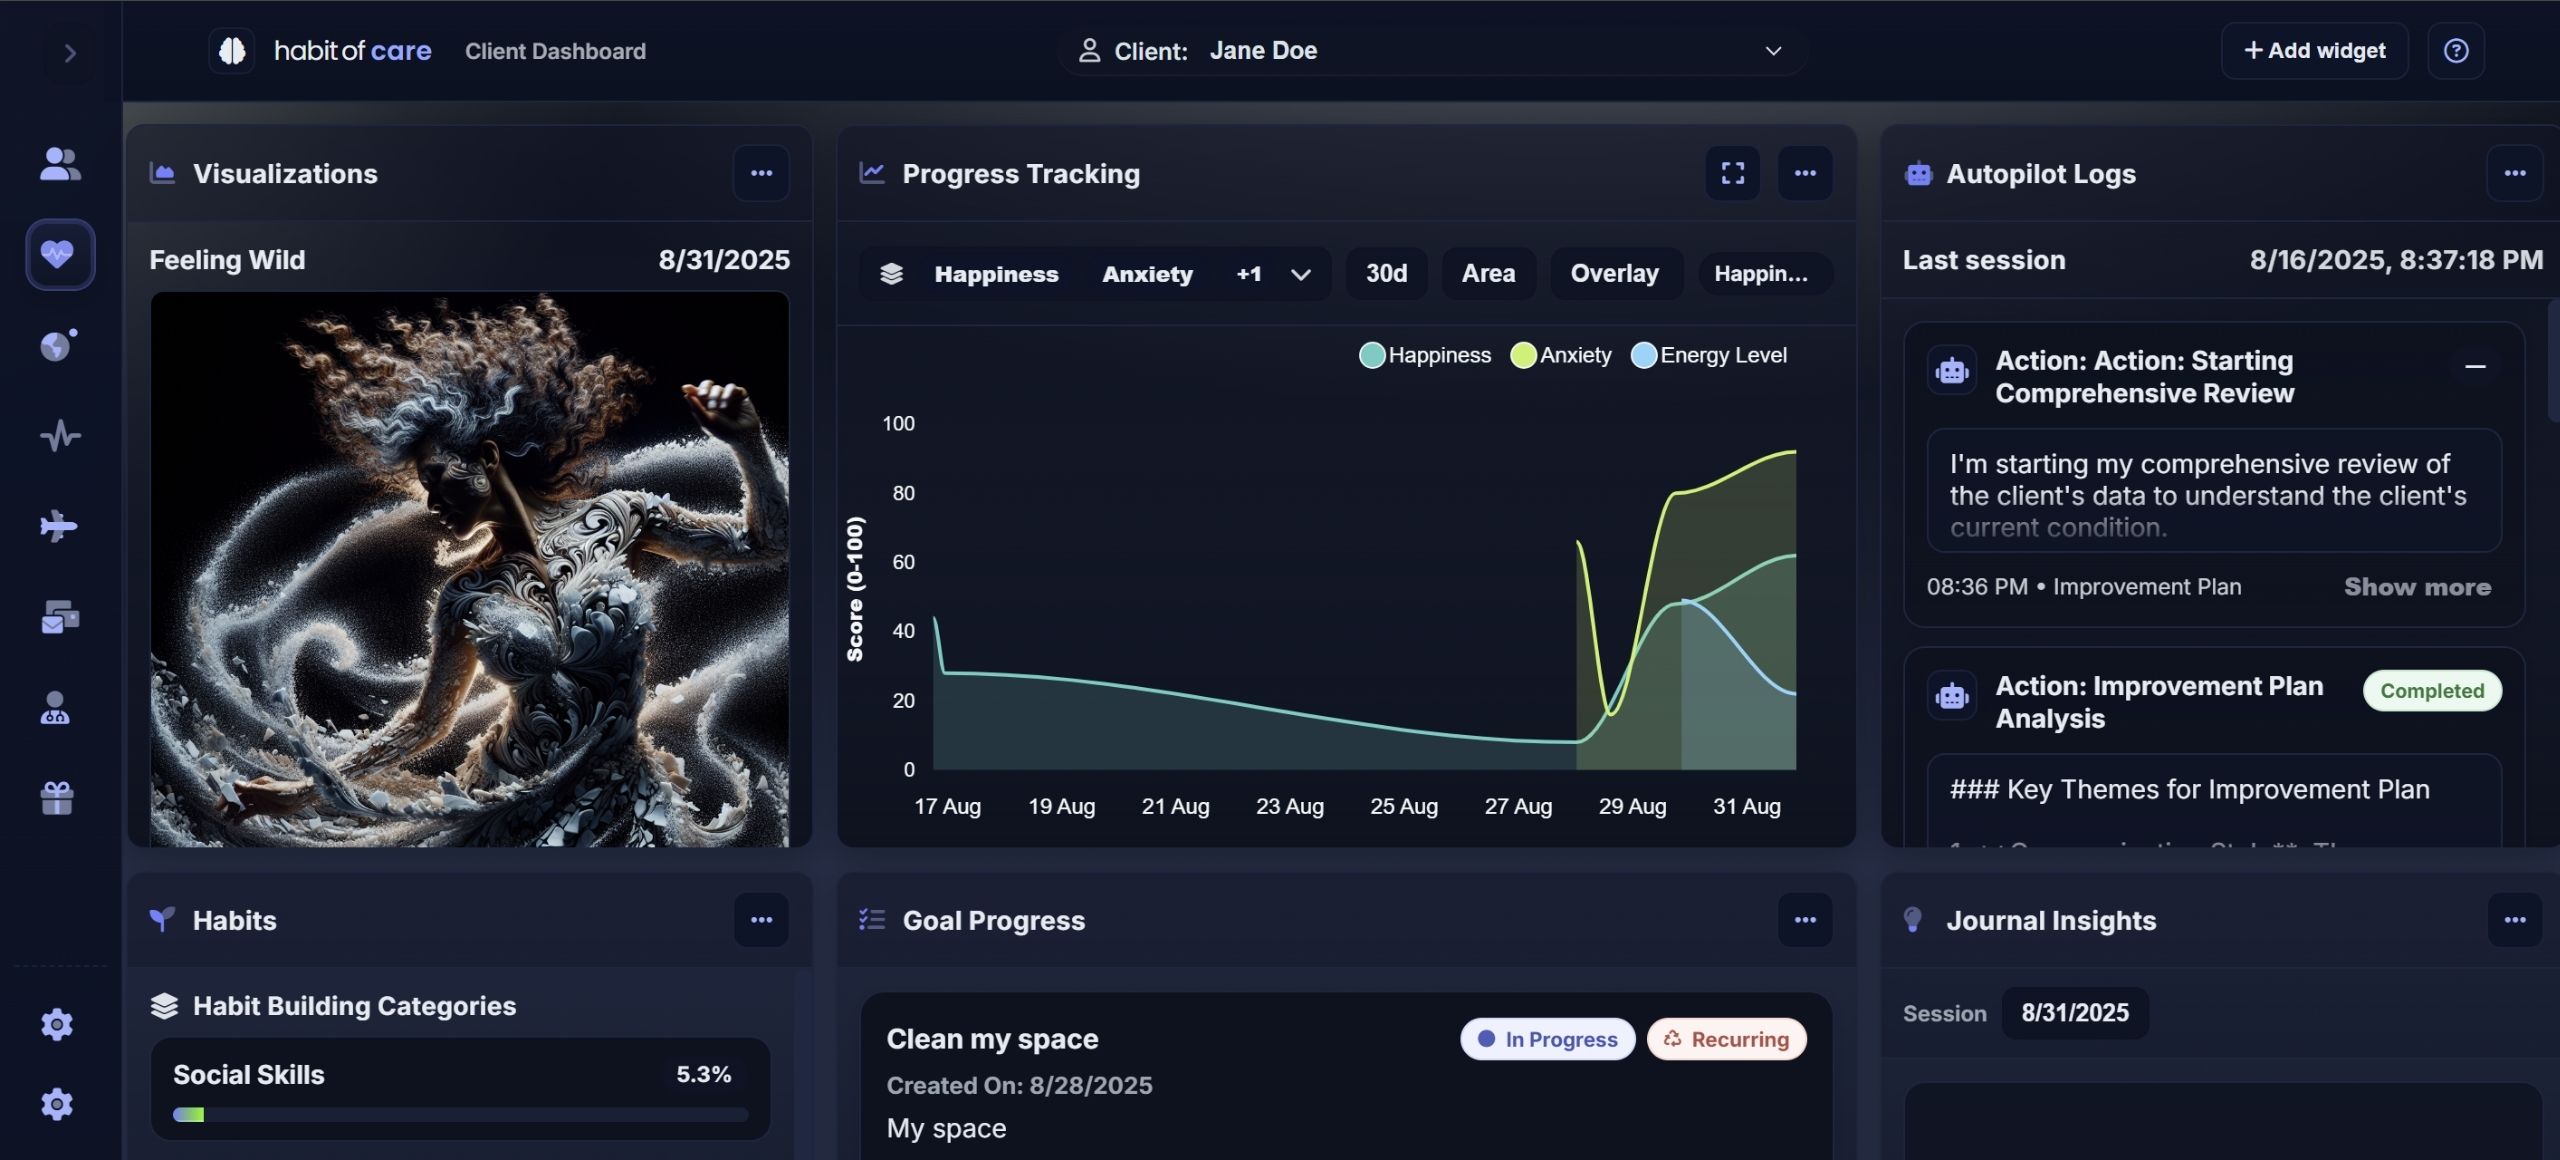
Progress TrackingTrends, milestones, and outcomes over time
Breathing ExercisesPaced breathing and calming drills with cues
VisualizationMental rehearsal for coping skills and goals
Habit BuildingTiny routines with reminders, streaks, and reviews
Narrative TherapyRe-author your story with structured prompts
Cognitive RestructuringIdentify, challenge, and replace unhelpful thoughts
Addiction RecoveryCraving tracking, triggers, and coping strategies
Issue TrackingCapture blockers, assign next steps, close loops
Self-Administered EMDRBilateral stimulation with step-by-step guidance
Goal TrackingSMART goals with checkpoints and reviews
Designed For All Behavioral Health Professionals
Automated homework, check-ins, and progress signals between sessions
Social WorkersResource navigation, benefits support, and proactive outreach workflows
Psychiatrists & PMHNPsMedication monitoring, side-effect check-ins, and safety flags
IOP / PHP ProgramsDaily skill practice, attendance, and discharge continuity
Primary Care & BHIScreening, brief interventions, and collaborative-care follow-ups
School & University CounselingCampus-ready check-ins, crisis protocols, and engagement insights
Case Managers & Care CoordinatorsTasks, referrals, and loop-closing across teams
Occupational TherapistsMental-health-focused routines, sensory regulation, and coping practice